|
This Is Where We Are in the AI Bubble
|
|
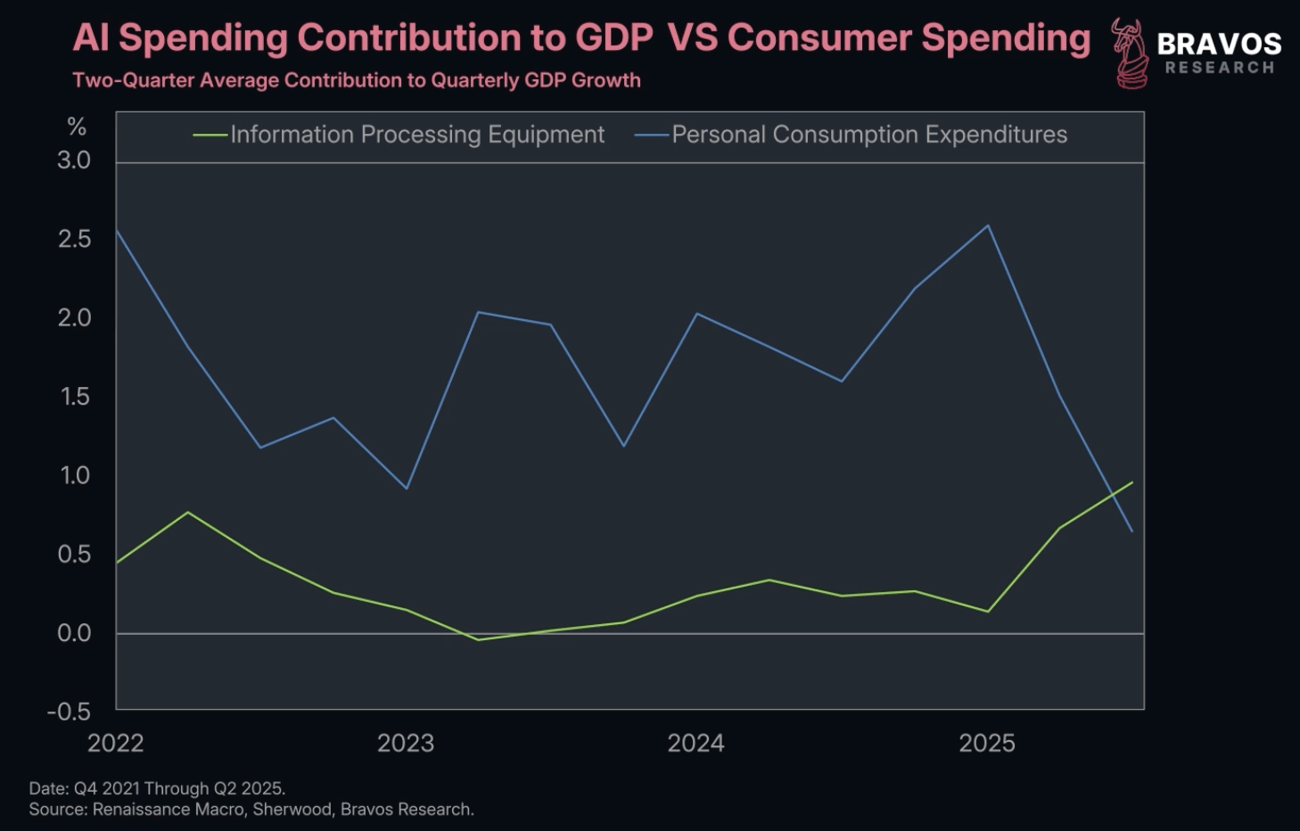
This chart shows us the contribution of AI spending relative to GDP and it’s just done something quite incredible.
It has now exceeded the contribution of consumer spending as a percentage of GDP.
So, spending on AI by large technology companies is now officially a larger contribution to GDP than consumer spending in 2025. |
|
 |
|
|
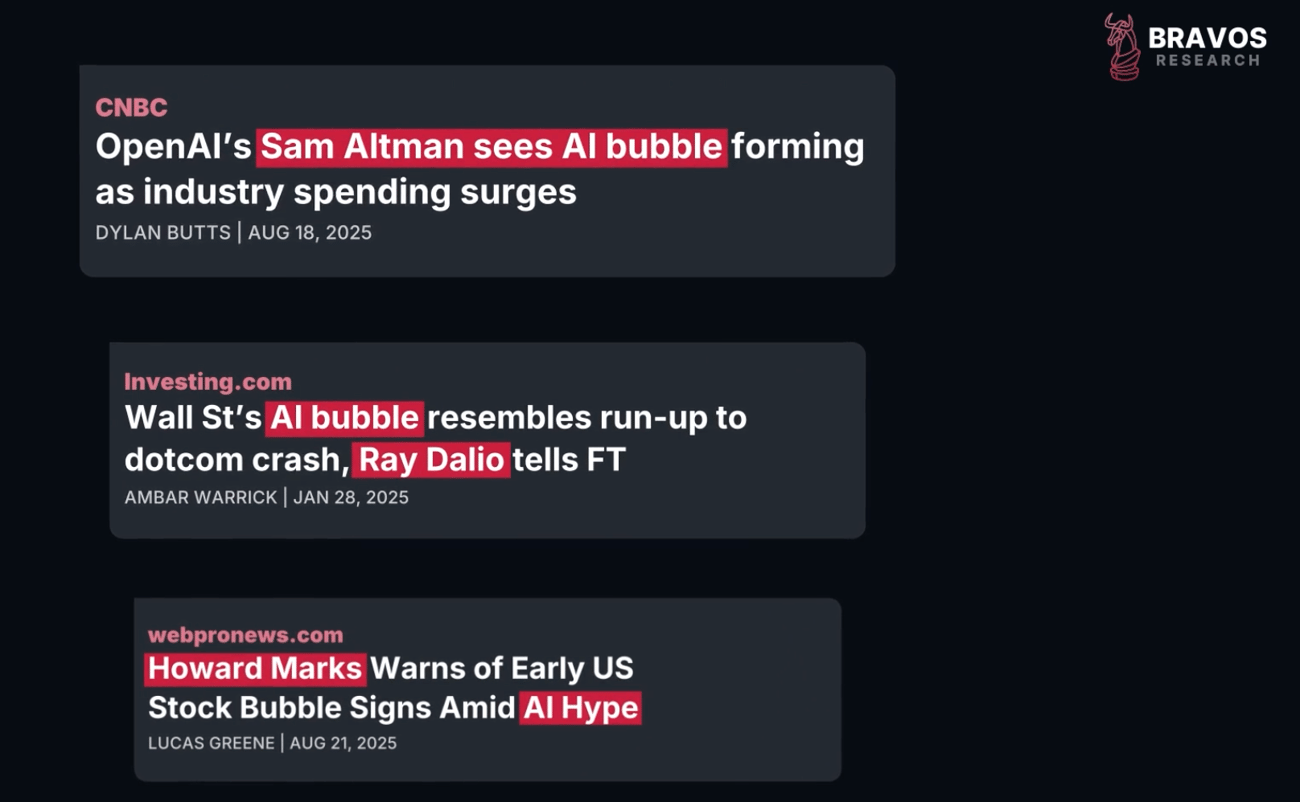
The excitement around AI is beginning to take over not only the stock market but the economy as a whole.
Many people are beginning to argue that an AI bubble has formed or is forming.
Asset bubbles tend to end with pain for both the stock market and economy.
If we're really experiencing an AI bubble, it's now more important than ever to understand exactly at what stage we currently stand. |
 |
|
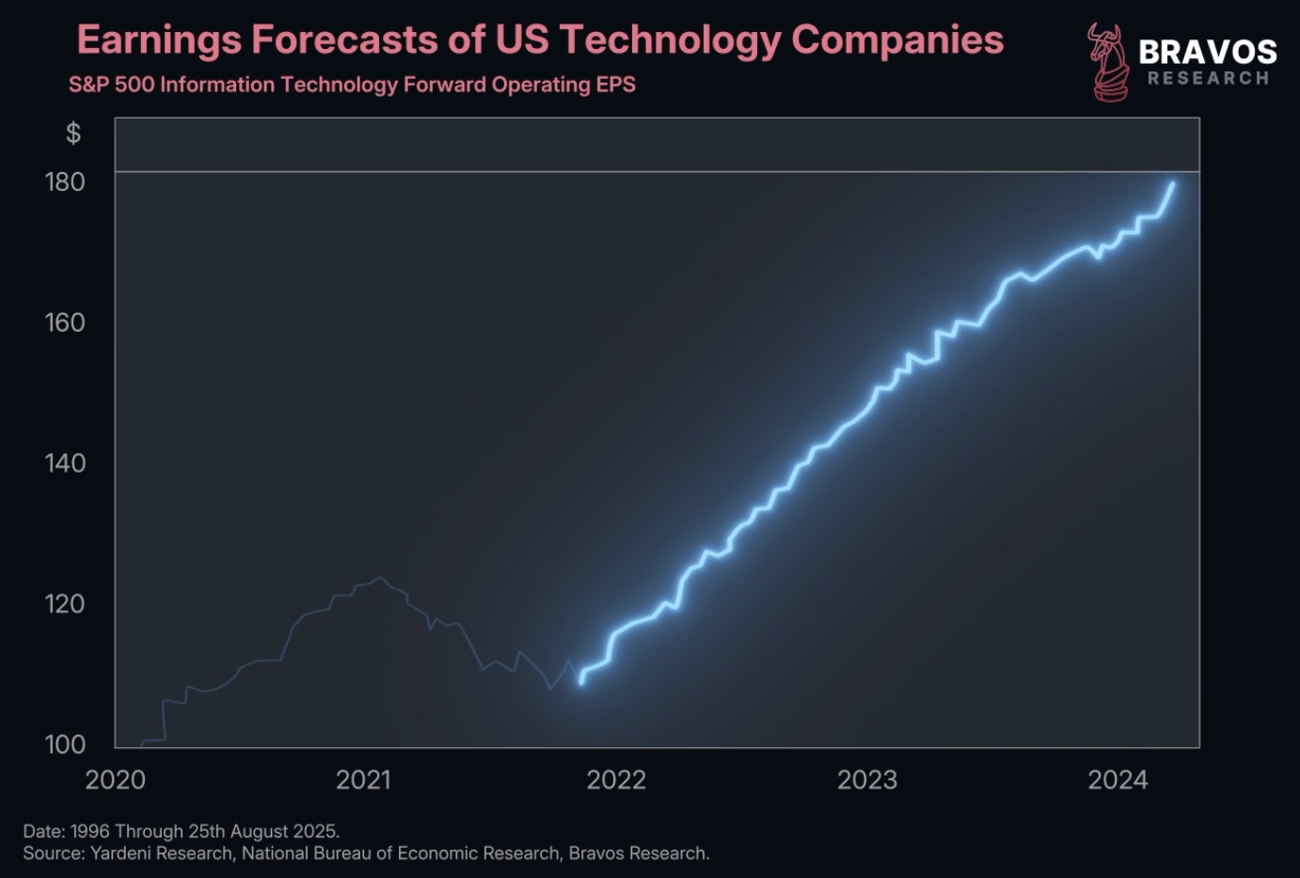
Earnings forecasts for US technology companies by Wall Street analysts have been going through the roof in recent months.
This institutional excitement has provided fuel for certain AI-exposed stocks to reach incredible valuations. |
 |
|
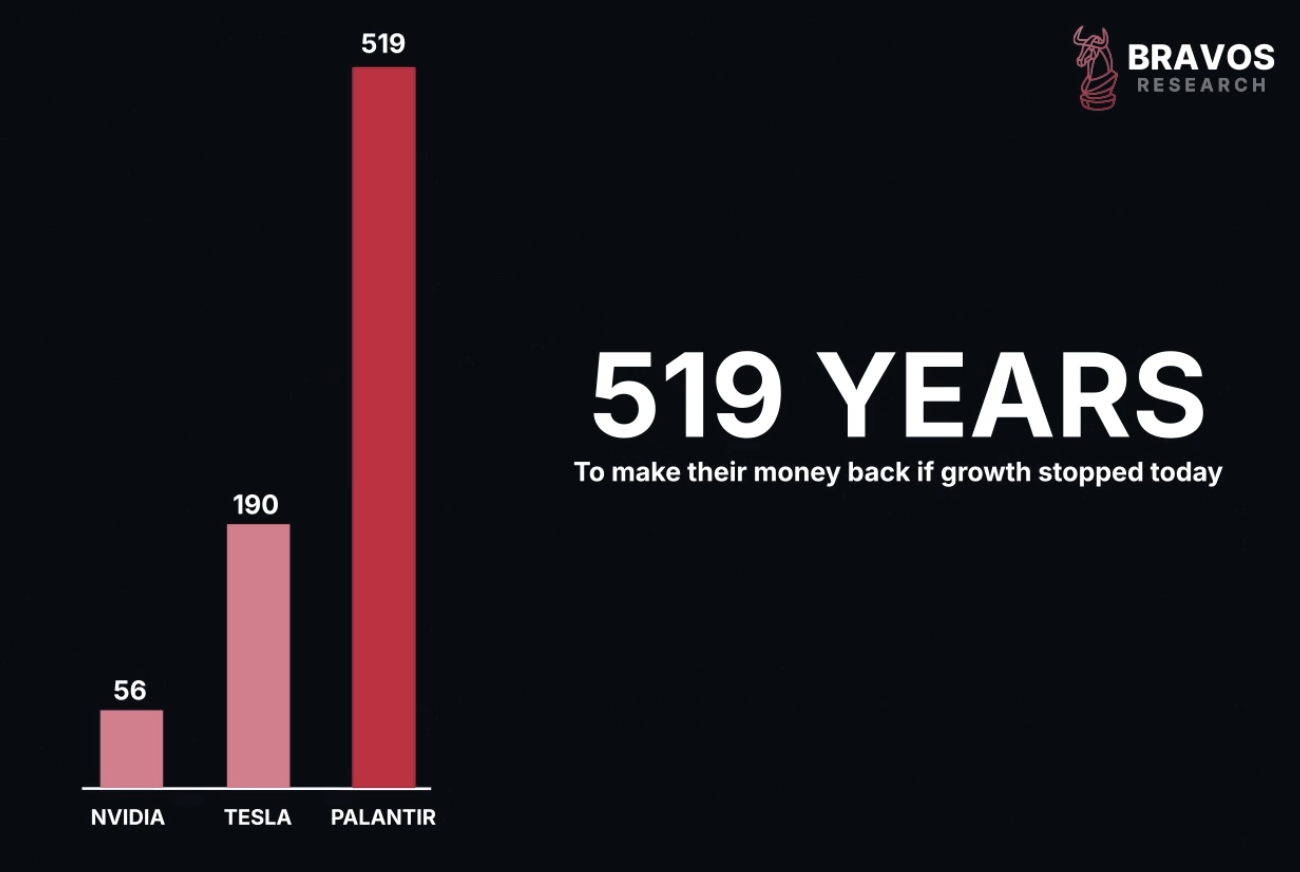
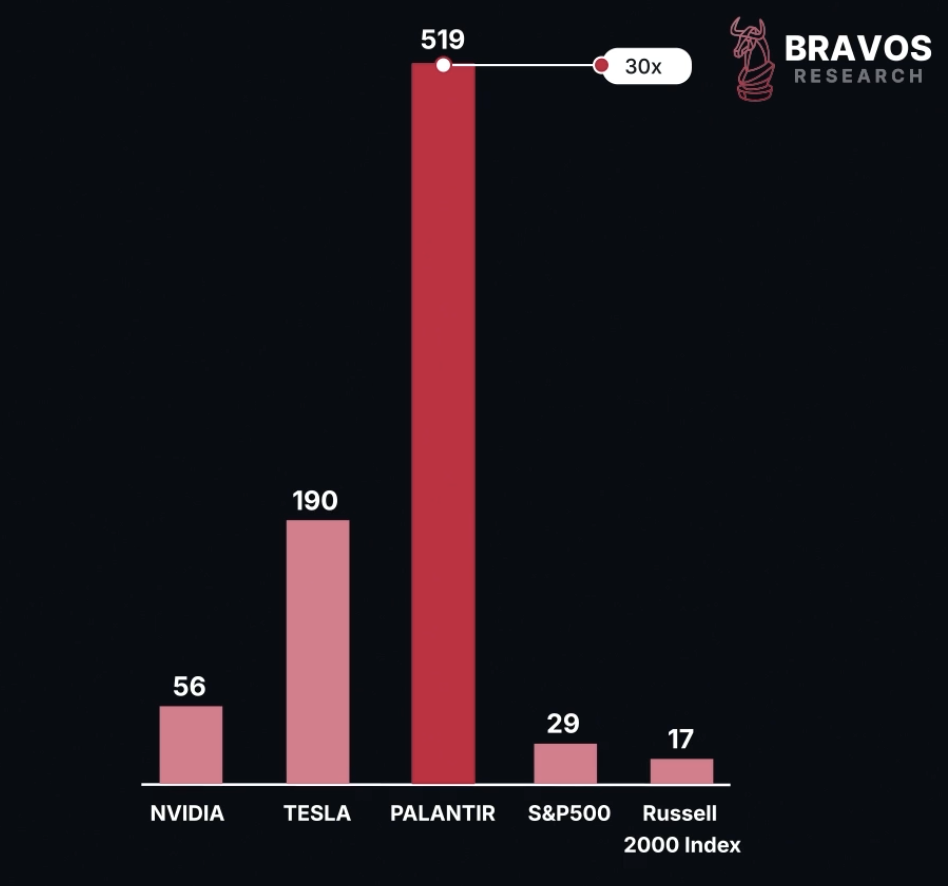
Nvidia currently has a price-to-earnings ratio of 56, Tesla of 190, and Palantir of 519.
This means Palantir shareholders would need to wait 519 years to make their money back if the company stopped growing today. |
 |
|
For comparison, the S&P 500 has a PE ratio of 29 and the US small cap index is roughly at 17.
So, investors are paying 30 times more money for a share of Palantir relative to a standard US stock. |
 |
|
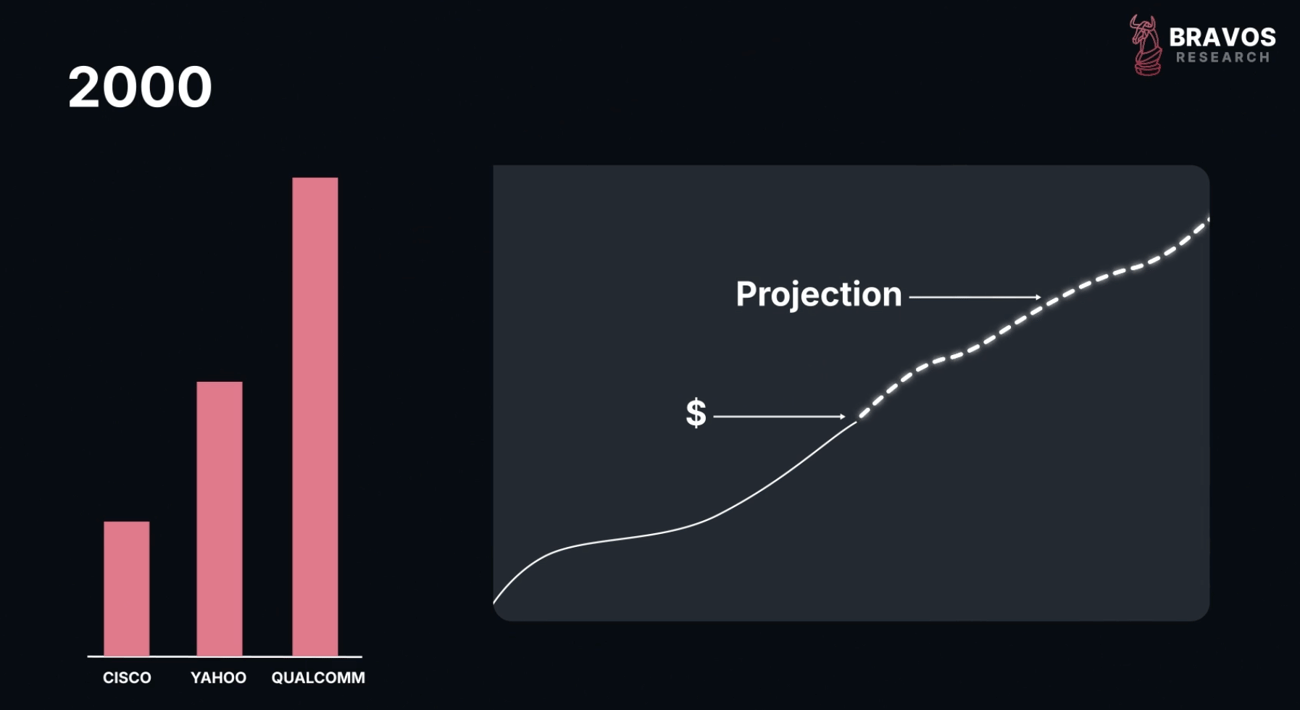
This is reminiscent of technology stocks during the late 1990s bubble.
These were companies growing quite rapidly back then.
The problem is that with these high valuations, investors were extrapolating that this growth would continue at the same rate far into the future.
When these companies disappointed these crazy growth expectations, the technology sector made a 180-degree turn as investors quickly readjusted their expectations.
This triggered one of the worst bear markets of the last 70 years, wiping out 50% of the US stock market and triggering a painful economic downturn. |
 |
|
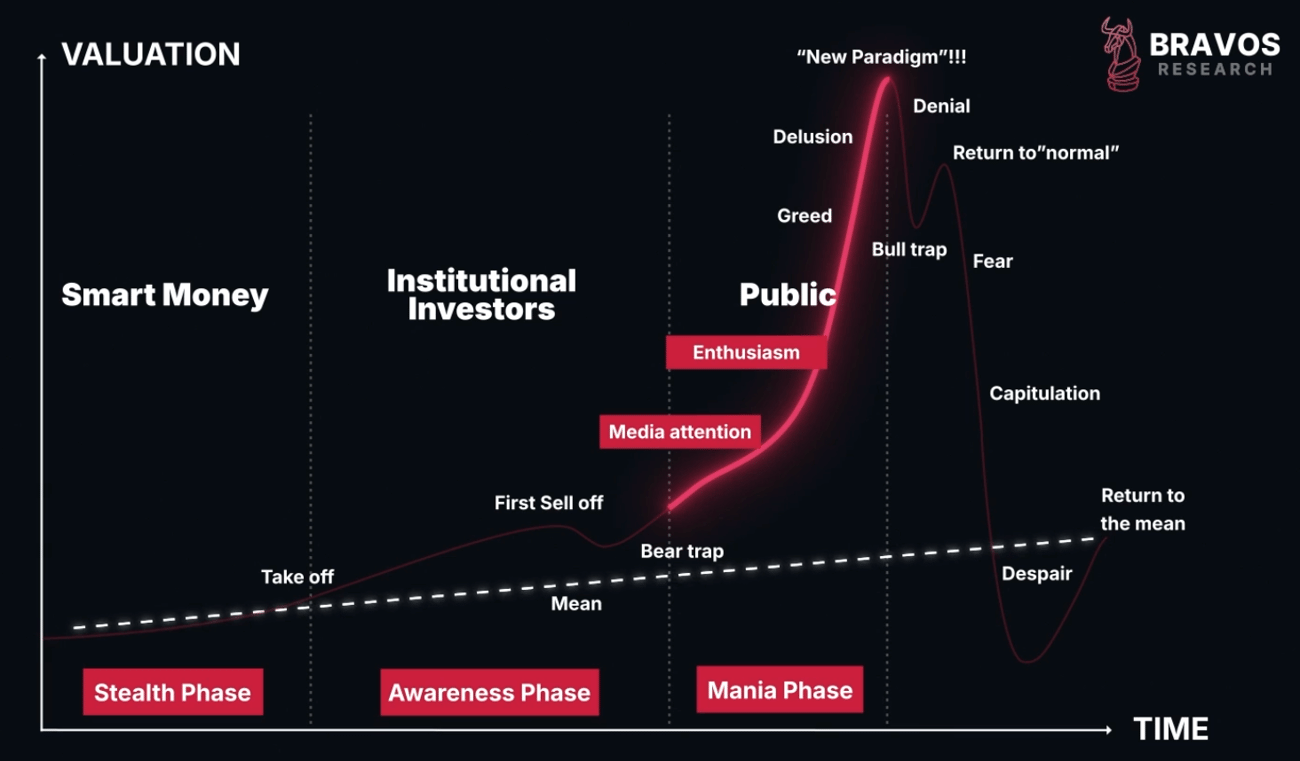
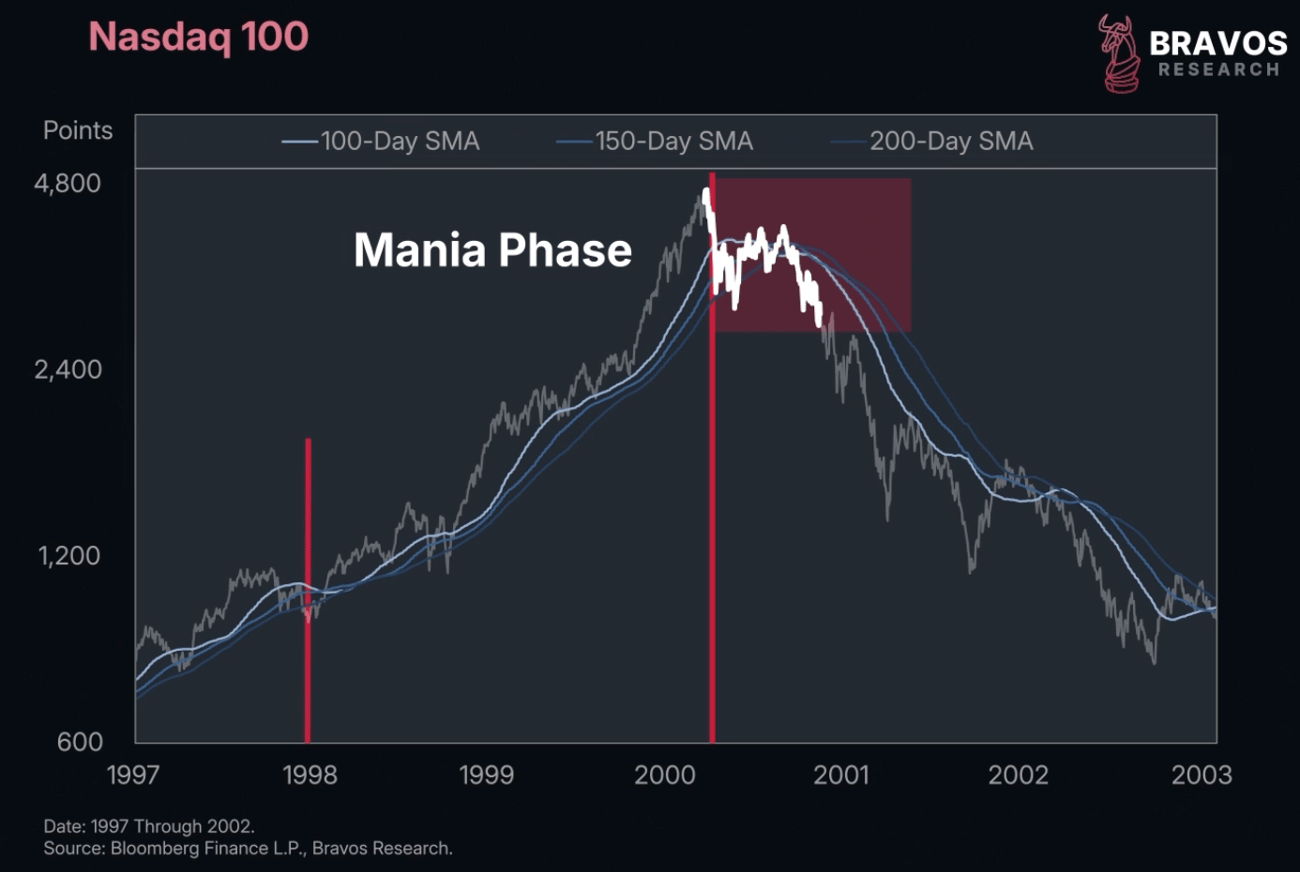
Typically, there are 3 phases to any bull market: the initial phase where early investors jump in, the awareness phase where institutional capital picks up on the theme, followed by the mania phase where you have extreme enthusiasm and significant media attention.
Today, from widespread AI enthusiasm, significant media attention, and high valuations, we know we're somewhere in this mania phase.
This also typically is when returns are the largest and the most money flows into the space. |
 |
|
To understand where we are in this phase, we need to look at 3 things that drive price during mania.
First: The momentum of the narrative.
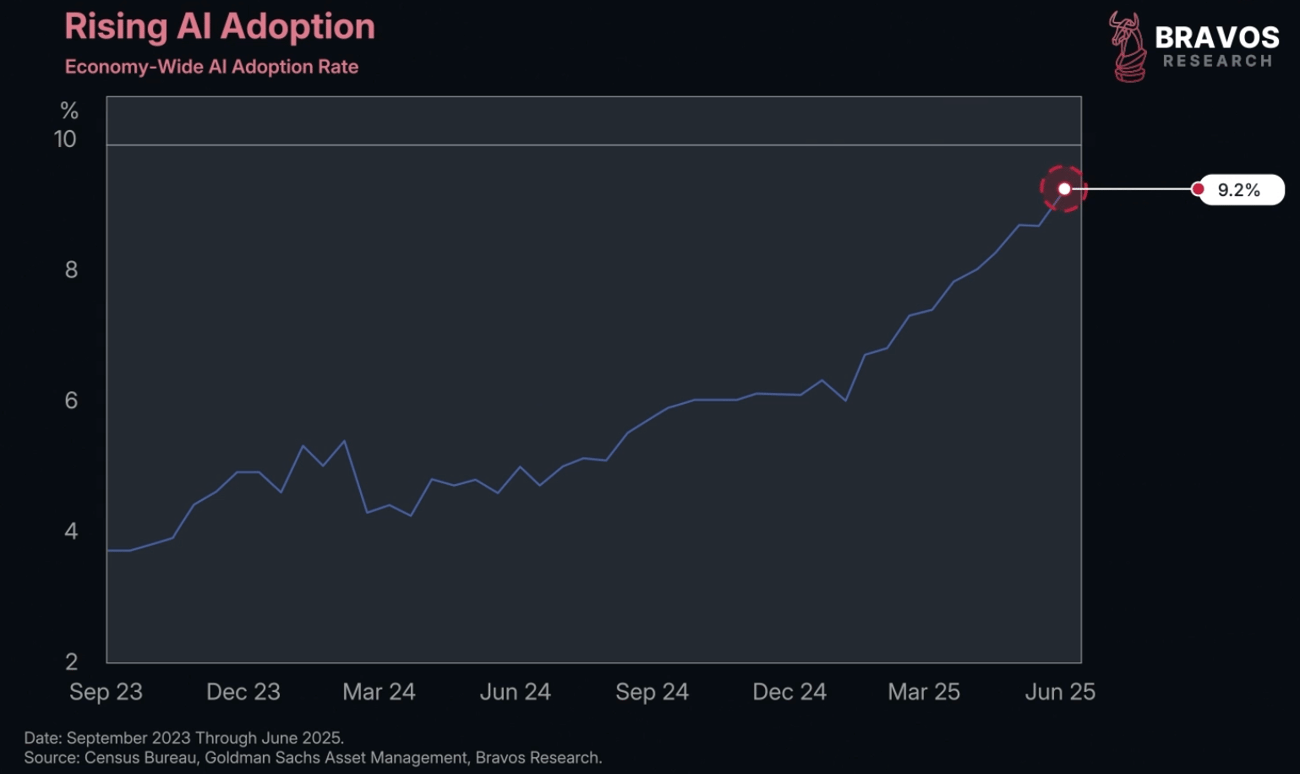
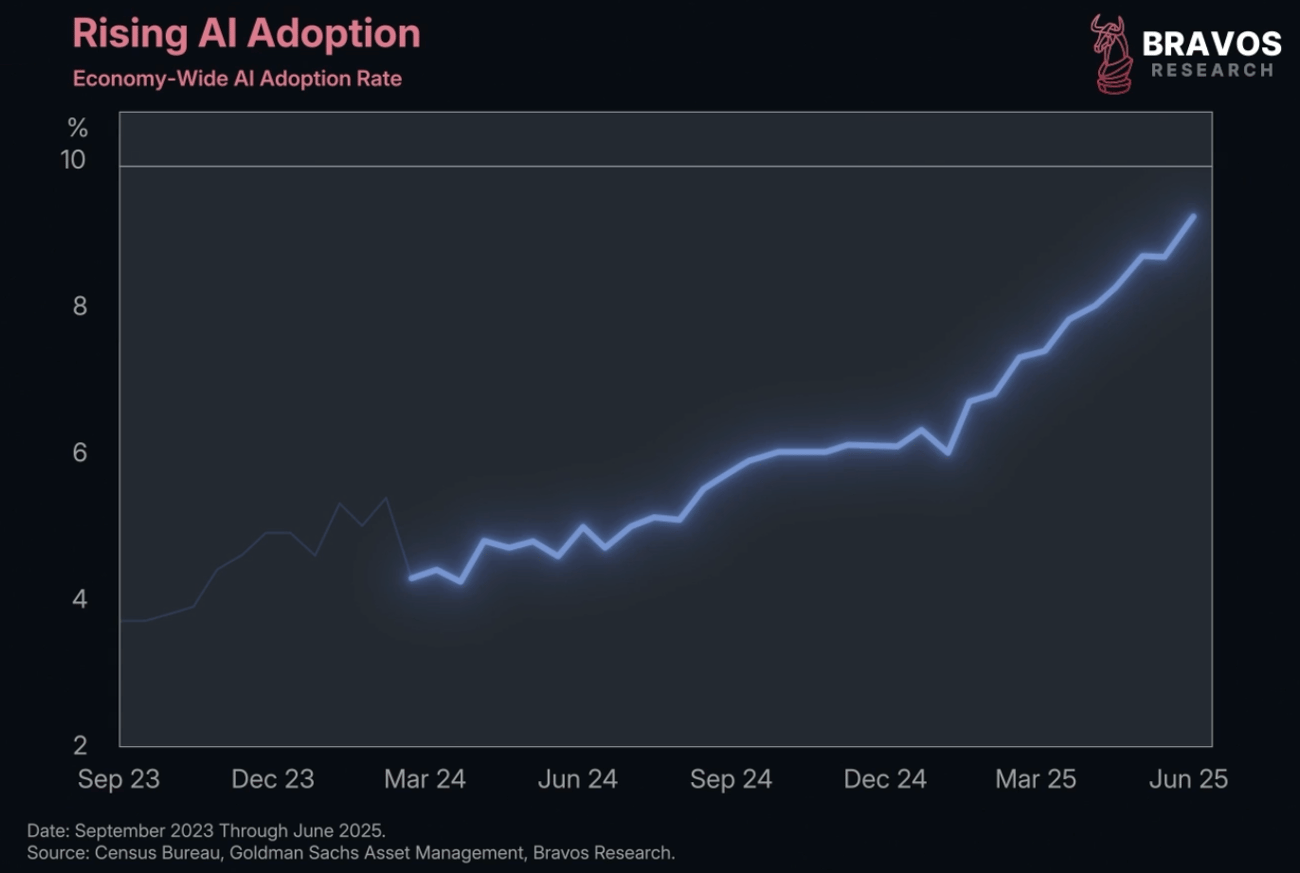
AI isn't just long-term speculation, but there is indeed real adoption taking place as we speak.
Currently, the AI adoption rate stands at 9.2%.
This uses data from Census Bureau measuring how quickly firms are adopting artificial intelligence across the economy. |
 |
|
What's incredible is that the rate of adoption seems to be accelerating.
As long as adoption matches expectations, the bubble will likely continue.
But if AI adoption shows signs of slowing, investors will quickly readjust projections, leading to significant repricing.
Although there's clearly extrapolation happening, we're not yet seeing signs this trend is slowing down. |
 |
|
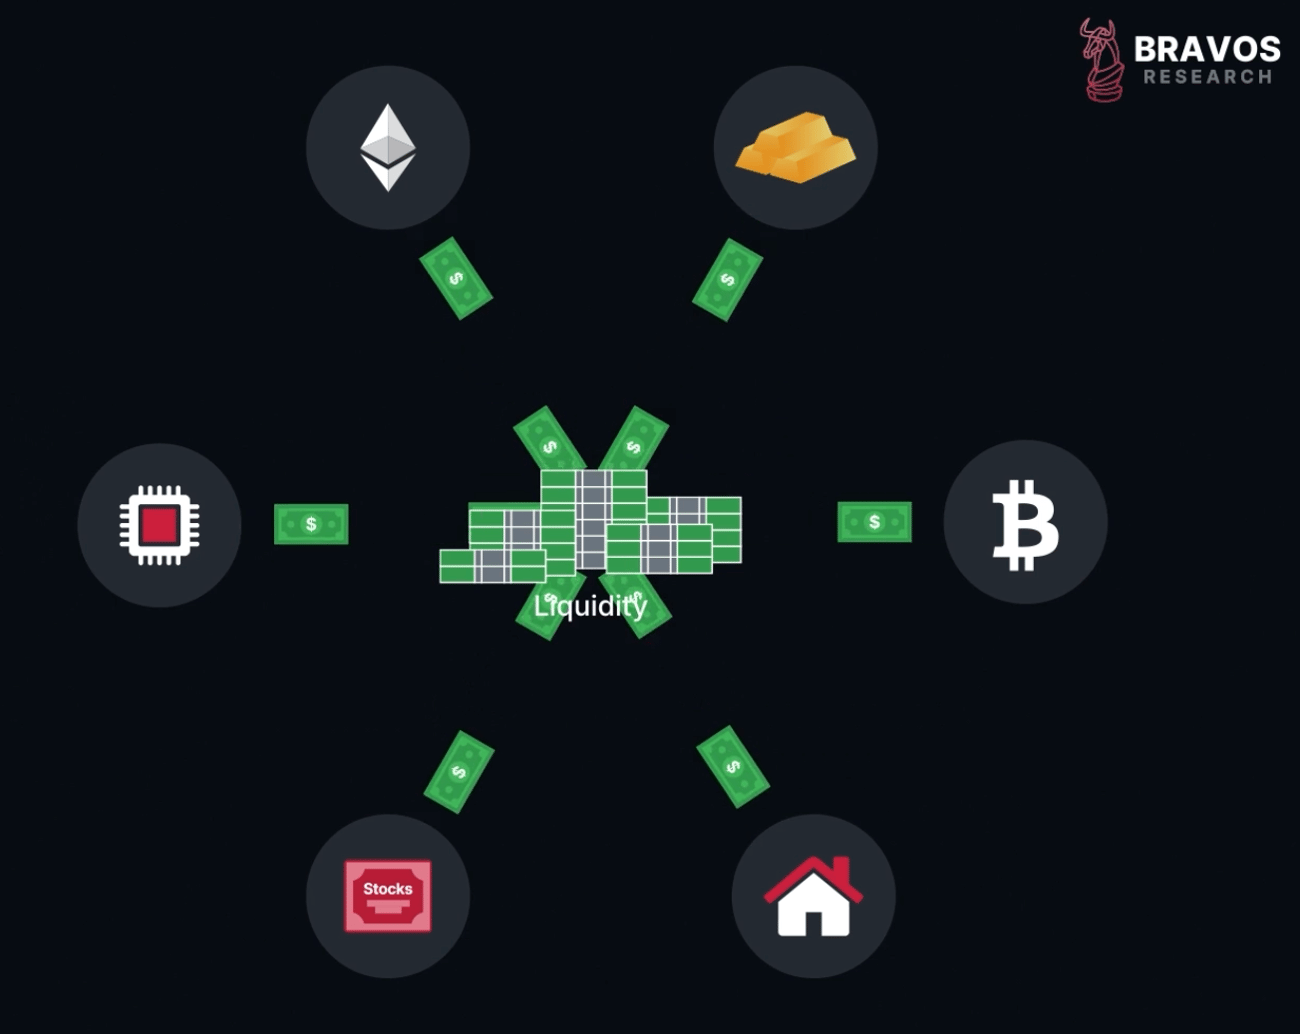
Second: The abundance of liquidity.
Liquidity is how much money there is available in the financial system that can flow into various assets, primarily dictated by central banks.
If global central banks are raising their interest rates, that makes borrowing more expensive and reduces liquidity.
When global central banks are cutting rates, that increases liquidity. |
 |
|
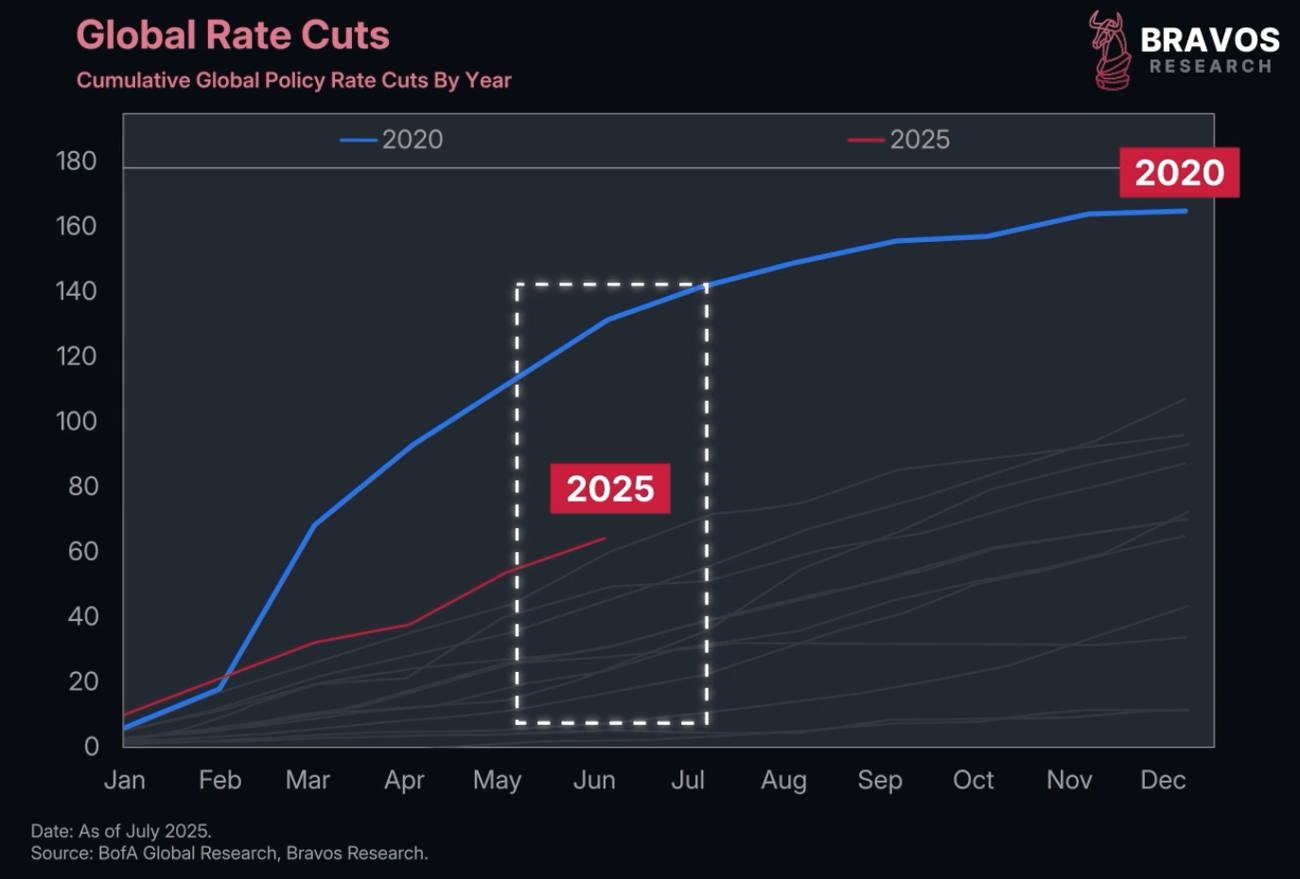
In just the first half of 2025, we’ve seen over 60 rate cuts from global central banks.
This is the 2nd largest number of rate cuts in the first 6 months of any year.
Only 2020 during the pandemic exceeded this.
And today, major central banks like the Federal Reserve have been announcing more rate cuts to come in the coming months.
So liquidity right now is abundant and doesn't seem to be showing signs of tightening. |
 |
|
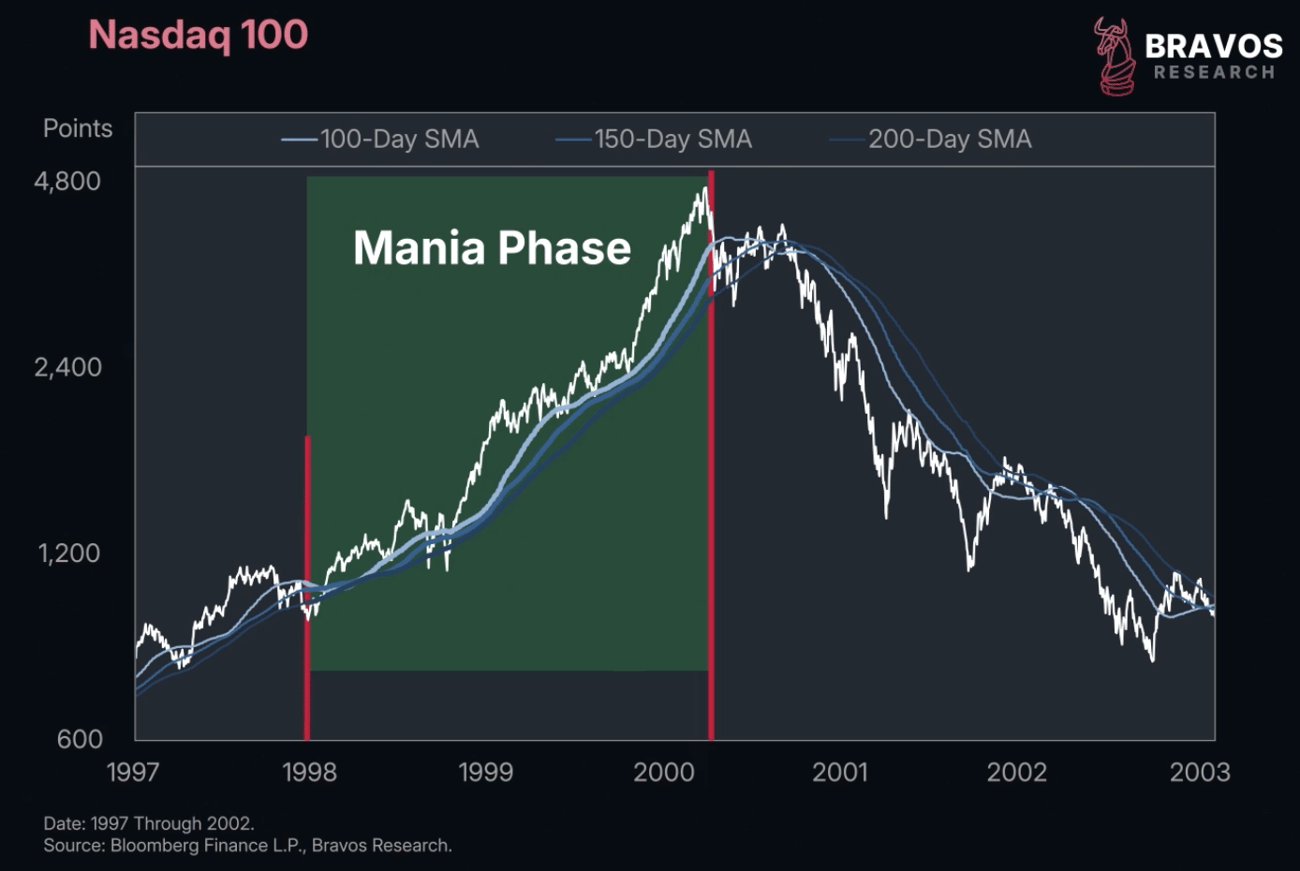
Third: The momentum of price.
This is by far the most important.
Looking at the Nasdaq 100 in the late 1990s, during the mania phase, momentum was extremely strong.
Moving averages pointed upwards and price stayed consistently above key moving averages. |
 |
|
However, when the peak was made, momentum began to turn around.
Moving averages curled downwards and price struggled to stay above them.
As soon as this happened, it marked the beginning of the Dot-Com crash.
You see, asset bubbles are all about the momentum of returns.
During bubbles, most investors know what's happening is irrational, but they still participate because returns are higher in this part of the market than anywhere else.
As long as momentum of returns stays strong, investors continue piling into this trade.
But when momentum slows down, that's precisely when that part of the market becomes vulnerable. |
 |
|
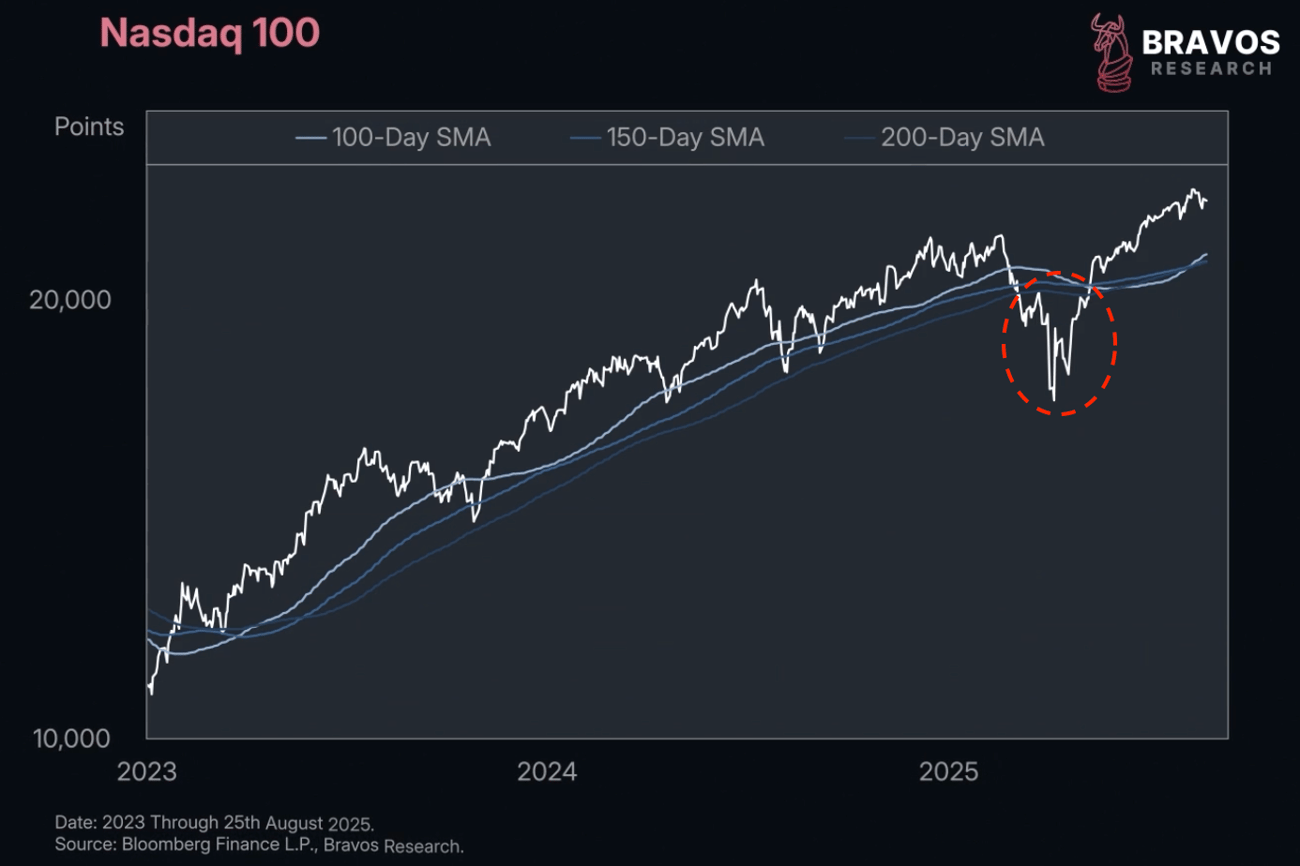
Today, when we look at the US technology sector, its momentum is strong.
Moving averages are pointing upwards and price is holding up nicely above them.
It dipped below them briefly at the beginning of this year, but underlying AI adoption has helped push these stocks right back into a strong posture. |
 |
|
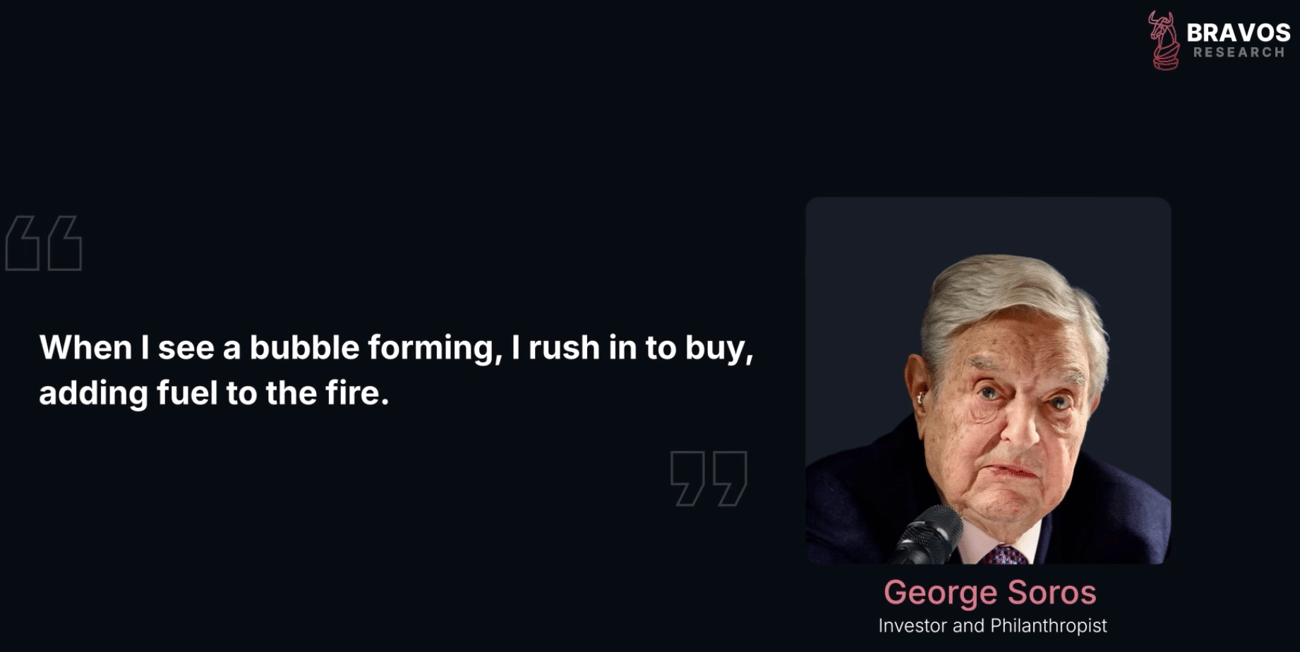
As George Soros once said, "When I see a bubble forming, I rush in to buy, adding fuel to the fire."
AI stocks are a bubble that is forming, and we're looking to add fuel to the fire.
We've studied the greatest macro traders of all times at Bravos Research, and we've adopted the very same principles that they use to build incredible wealth in the market.
These rules are what allow us to be exposed to the right parts of the market at the right moment and also make sure that we have very limited losses when we are wrong. |
 |
|
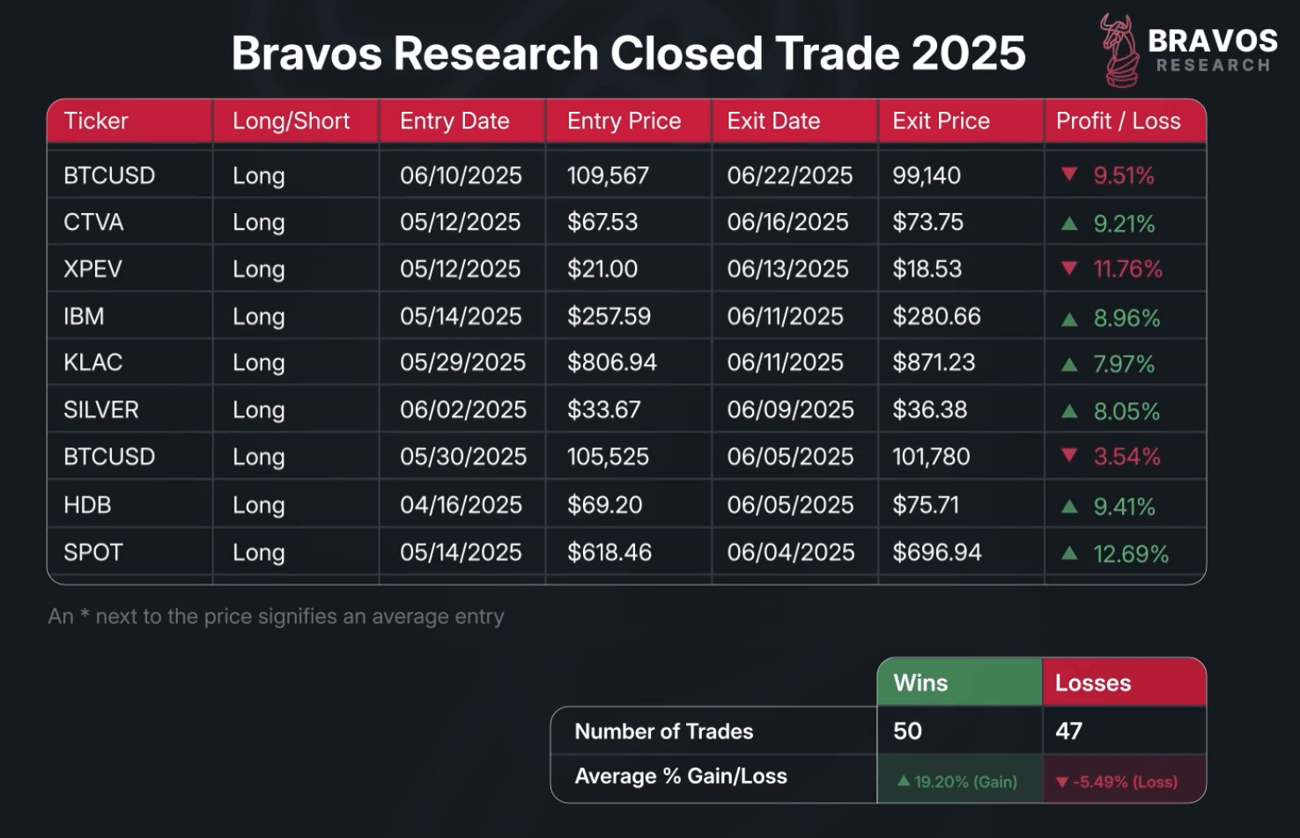
This has provided us an average gain of almost 20% on our winning trades versus a 5% loss on our average losing trade.
We recently booked a 19.6% profit on $AEM and 21.8% on $GOOGL.
You can view our 2024 track record for free on our website here.
Click here to get our complete Trading Strategy and real-time Trade Alerts
|
 |
|
|
|
Interested in more insights like these?
This article was originally published on Bravos Research. For more in-depth analysis and exclusive market insights, visit Bravos Research.
Contact us 24/7
Remember, we're here to help. If you have any questions, please contact us.
Warm regards,
The Bravos Research Team |
|
|
